@labplot@lemmy.kde.social @dataisbeautiful
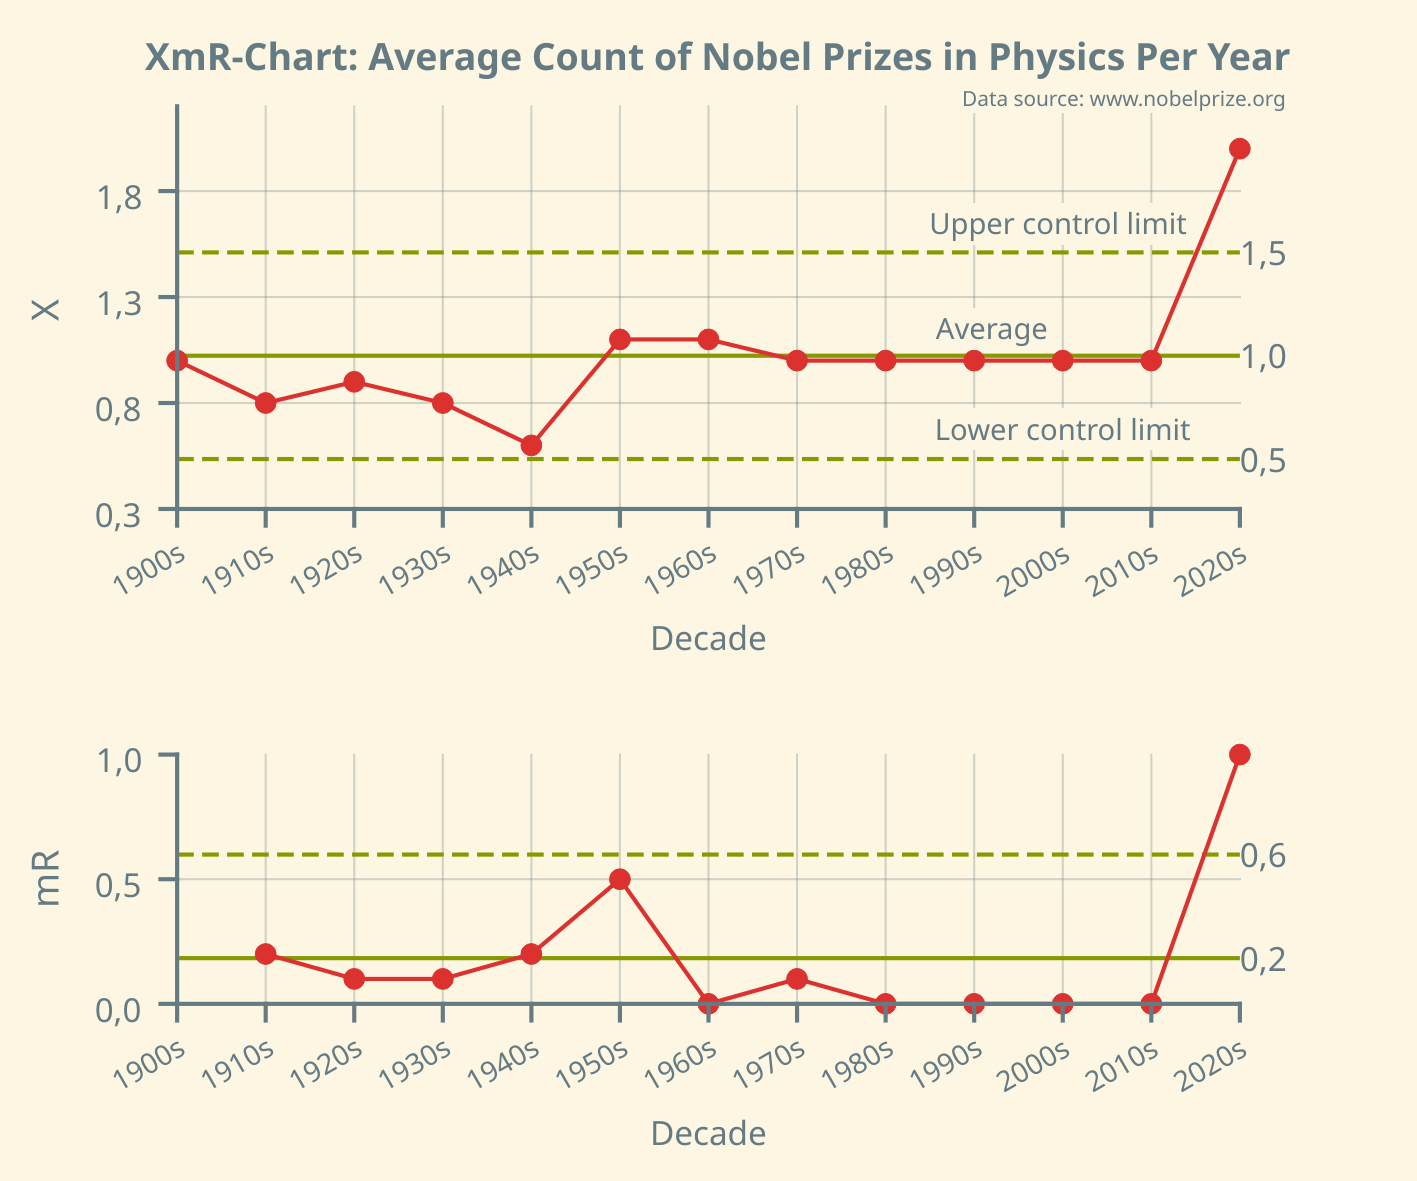
The XmR chart, made in #LabPlot [2.12dev], of the count of #Nobel Prizes in #Physics awarded in the years 1900-2024.
A single point falling outside the computed control limits should be interpreted as an indication of an assignable cause exerting a dominant effect on the process.
#DataViz #Statistics #DataAnalysis #Science #OpenSource #Data #FOSS #FLOSS #FreeSoftware #XmR #Shewhart #Deming #ControlChart #Visualization #ContinualImprovement
You must log in or register to comment.