You don’t need to download/CSV anything if you don’t want to.
Open Excel, Data tab, Get Data, From Web, paste in the linked website(change the url to the right time period if you want a specific one), it will automatically detect the table(s) of data, select the right one (if there are multiples on a page) and load the data directly.

Is this their “salaries” for the quarter only? If there’s multi lines, it’s cumulative I guess?
Last Quarter (Q2): total expenditure by name, with all costs added to salaries (generated by chatgpt)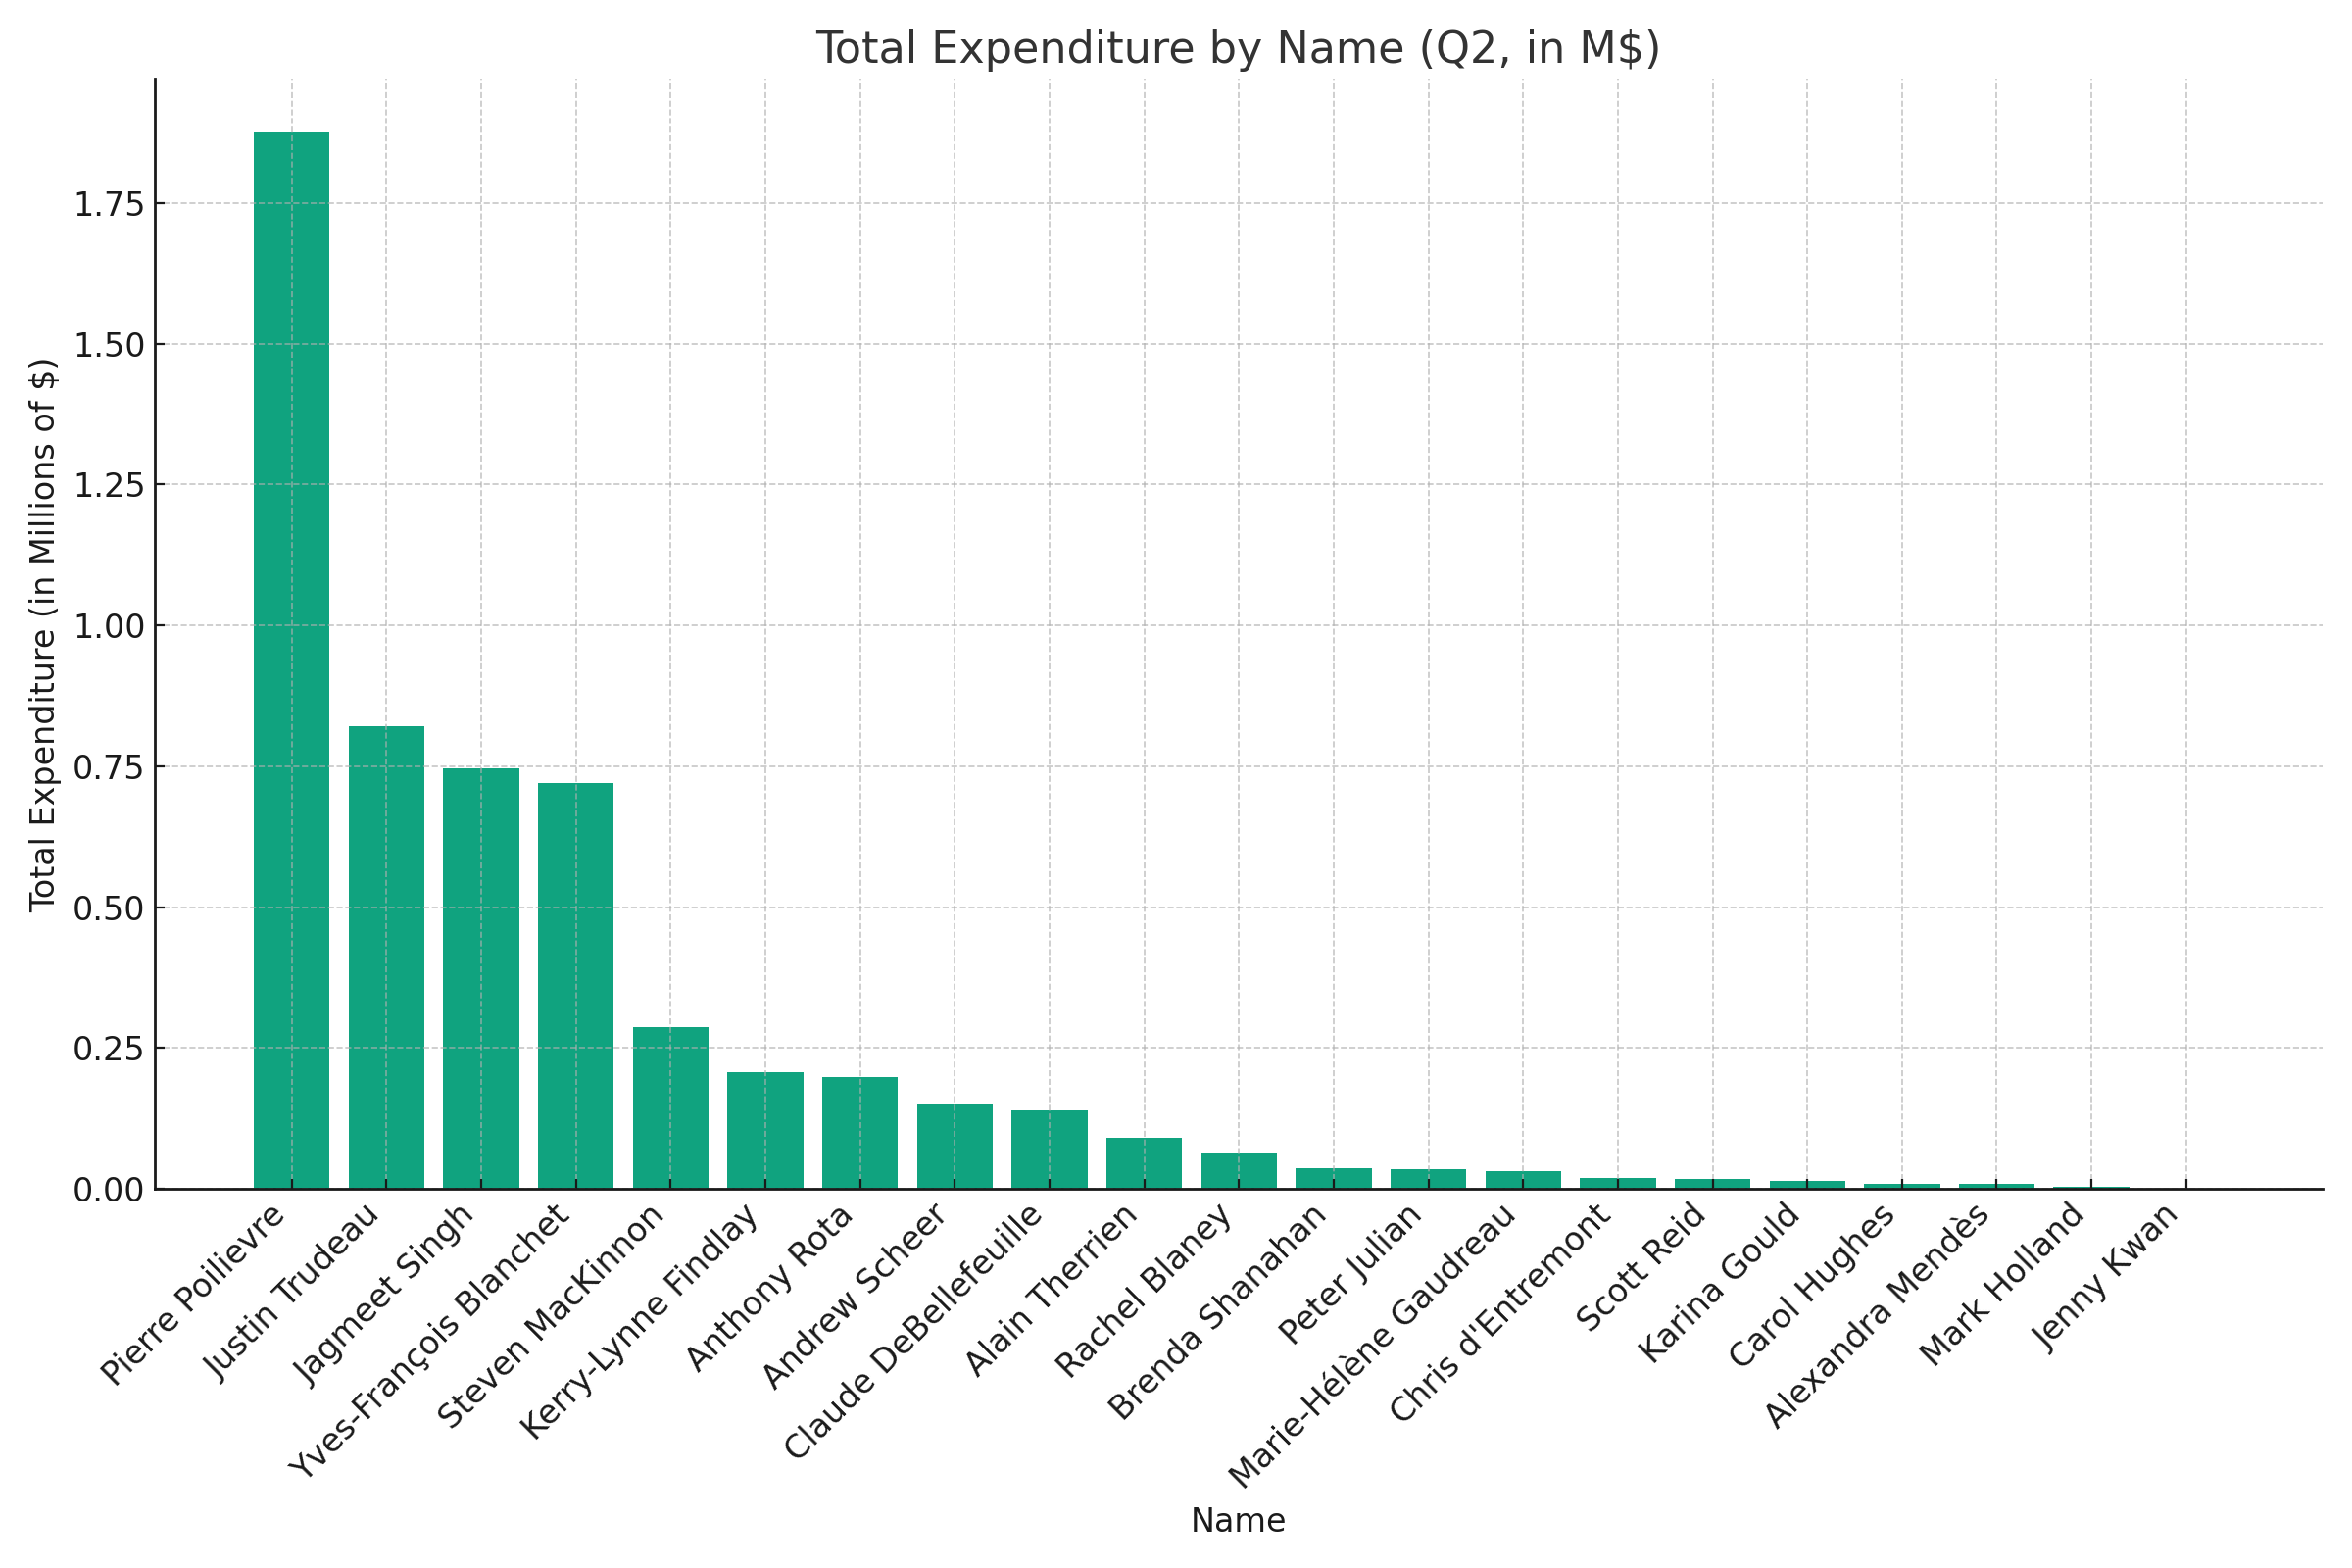
Previous Quarter (Q1):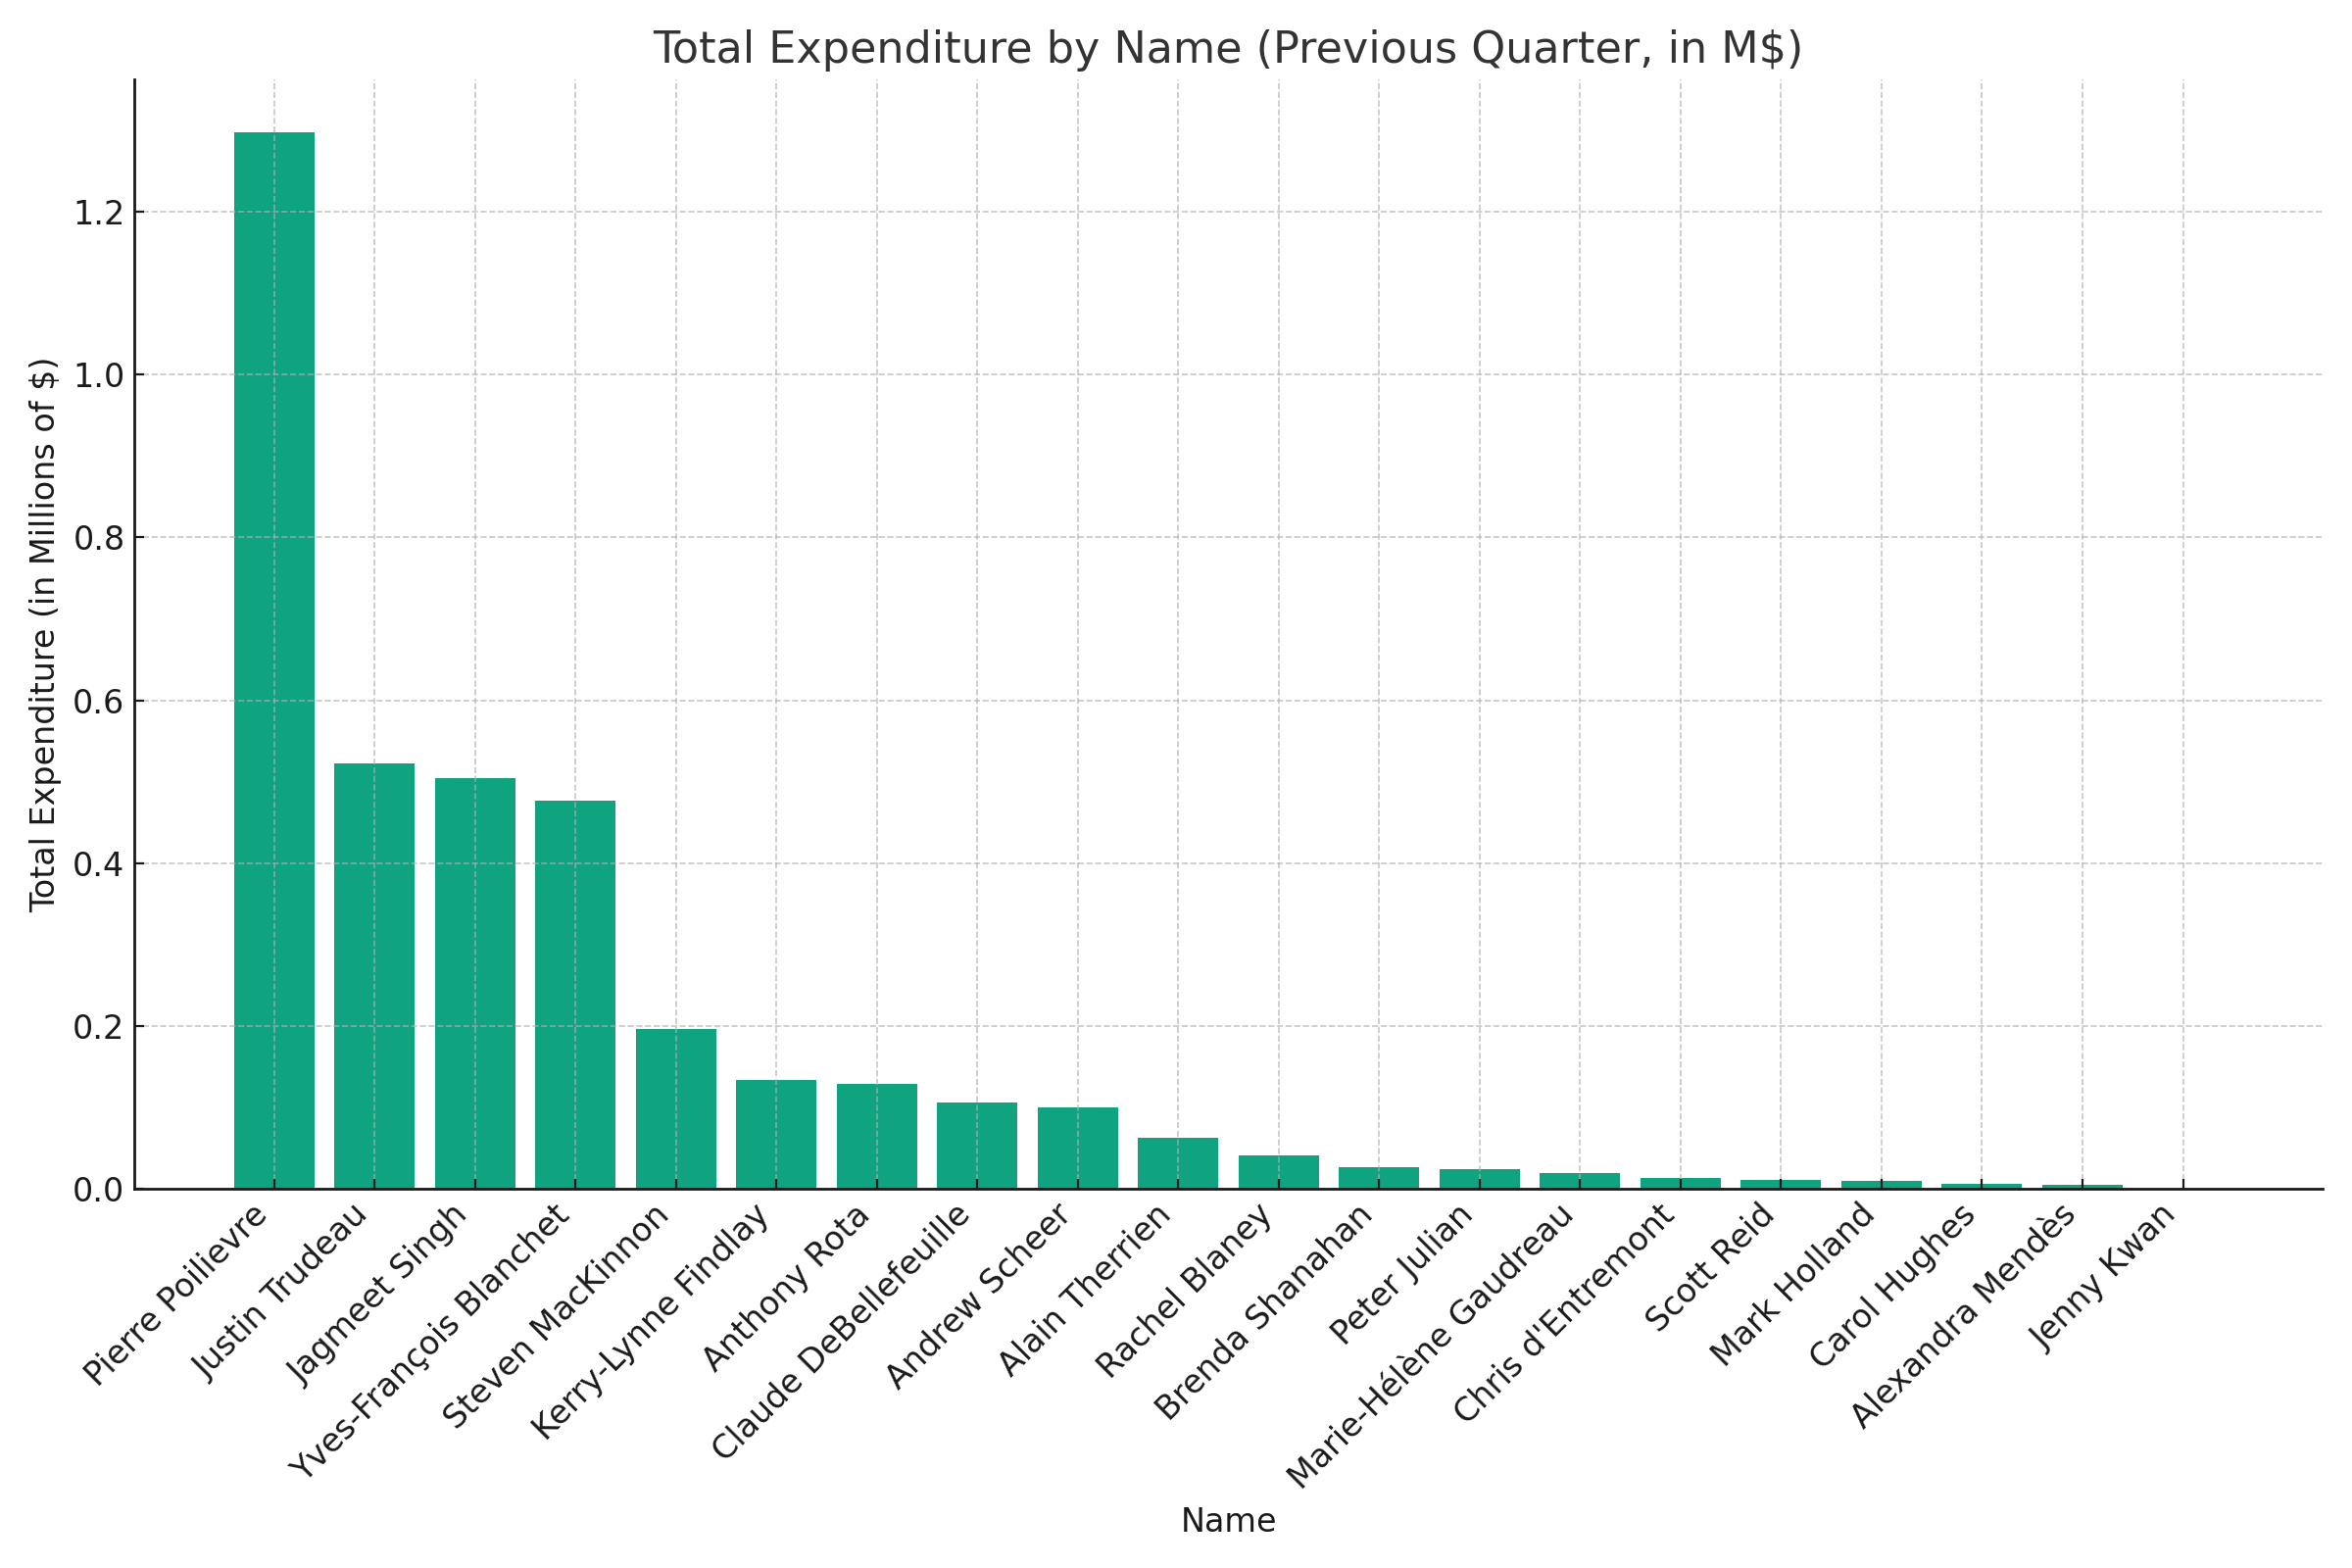
GPT can generate graphs? I’ll have to download the the CSVs and crunch the numbers myself. I don’t fully trust GPT for something like this.
You don’t need to download/CSV anything if you don’t want to.
Open Excel, Data tab, Get Data, From Web, paste in the linked website(change the url to the right time period if you want a specific one), it will automatically detect the table(s) of data, select the right one (if there are multiples on a page) and load the data directly.
Yay Excel.
I’ve checked for poilievre mentally and it should be close enough